
This set of enhancements came from our power users, consultants, and our summer of strategizing over how to capture and present the right customer and company scores to show how you’re doing with your customer experience in a simple and visual fashion. To do that we’ve come up with the concept of 3 key customer scores and 3 key company scores and added them to our statistics package. We also came up with a method to show some auto graphs of these scores on maps.
Check out this guide to learn how to build your own Customer Journey Map.
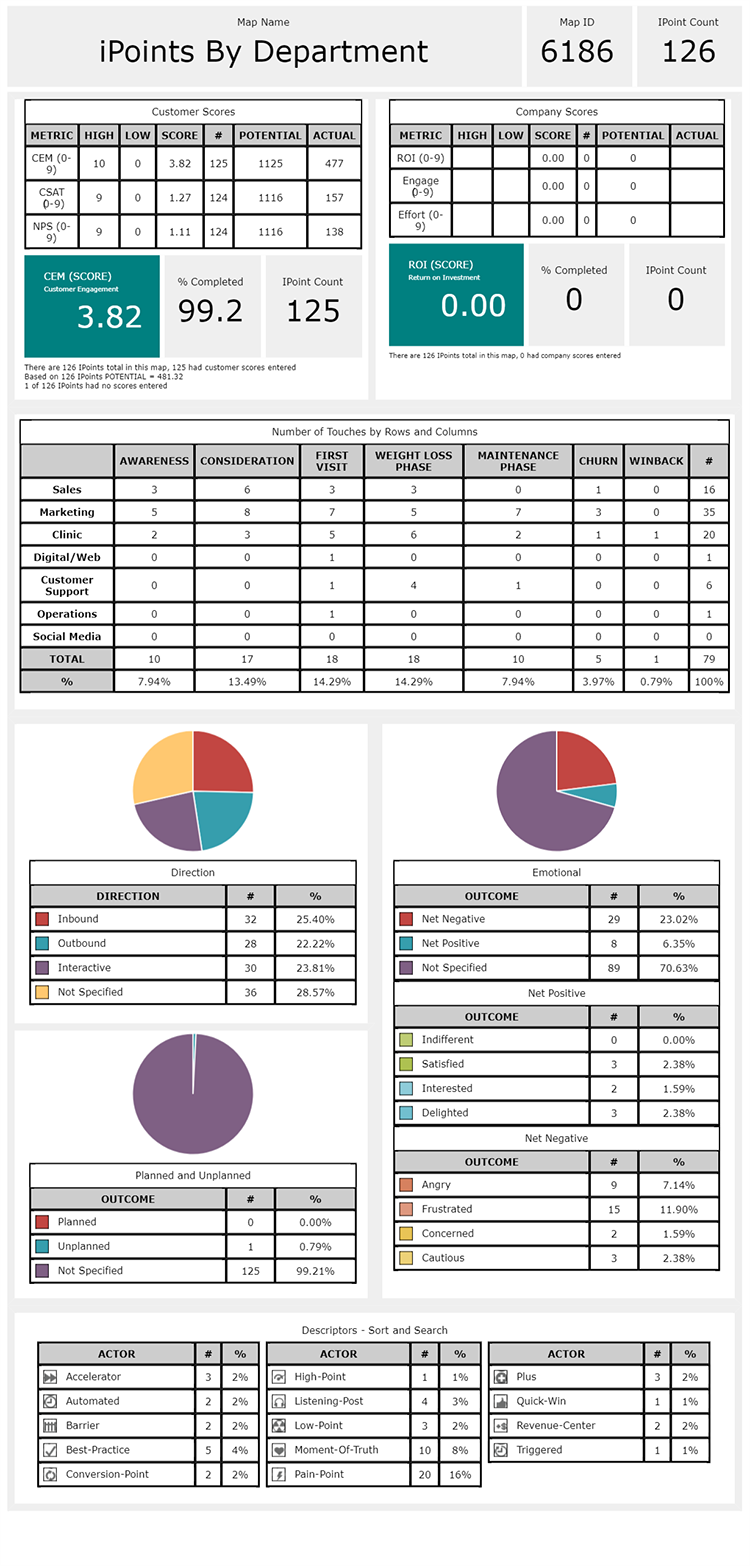
Statistics View Make Over
Our map statistics package has been re-designed for easier reading. We have also divided up the summary between what we are calling “Customer Scores” and “Company Scores”. Due to this delineation, we have also added 3 more Scores to measure and track. Customer Scores include things like CEM, CSAT, and NPS. Company Scores (these are new) include things like ROI, Engagement, and Effort. It is important that we start to look at both sets of scores as practitioners to get a more true sense of how we are doing with our customer and as a company. ROI is increasingly important especially as compared to engagement and effort.
You can locate this package by going to any map and clicking on Download Data and Statistics for this map → See this map’s statistics. Remember, the data here is only as good as what you’ve loaded into your IPoints. The rest of the report has been simplified to only show the data we feel is most important and relevant.
Auto Graphs in the Executive Summary (Hybrid) Map
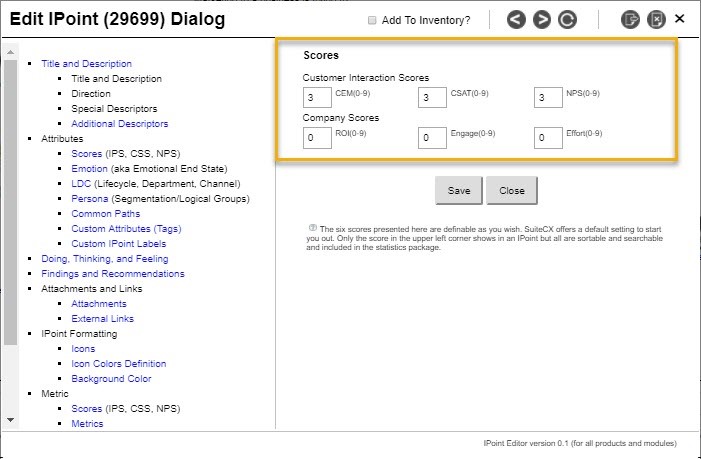
We’ve added an auto graph feature to the 3-10 column hybrid map. You can add it when you configure your hybrid as one of your rows. This graph is based on the Customer and Company scores that you’ve populated in the IPoints on the same map. As you noticed in the new Statistics package above, we’ve added the concept of company scores to our customer scores. We now have 6 scores to add at the IPoint level (3 for customer and 3 for company) and those are the scores that drive this auto graph.
This is where you load the scores into our new IPoint editor (update on this new editor coming in the next blog);
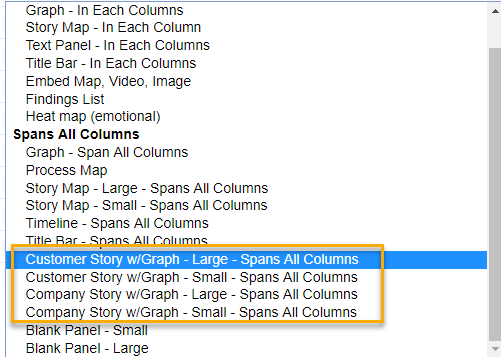
This is where you select these auto graphs to appear in one of your rows in the hybrid map configuration;
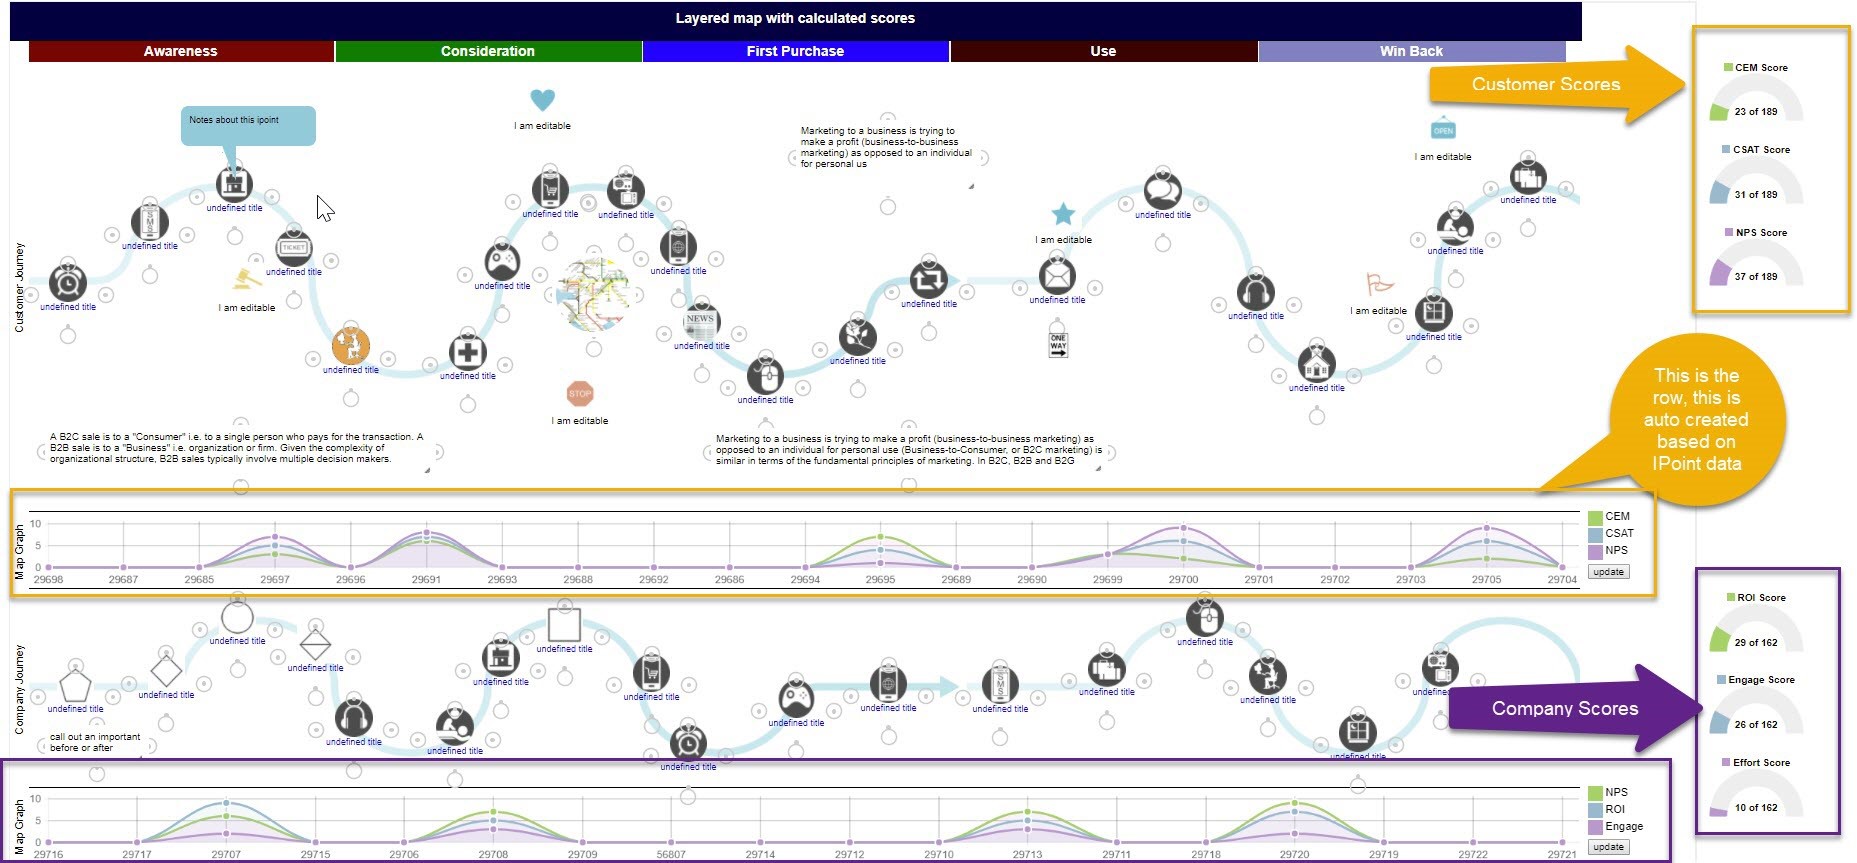
Layered Map with Auto Scores
This is what it looks like all together in a layered map or hybrid map. We are progressively moving towards more auto-map features. In this case; the customer story with graph shows the 3 customer scores from the IPoints in the map above it and the company story with graph shows the 3 company scores.
Get Started with SuiteCX!
Can you imagine how it might be useful to show trending customer and/or company scores on your customer journey maps? Hopefully these changes will make your SuiteCX user experience even better. Remember to contact your coach if you want any personalized training or consulting or contact us to get started with your own license!
Share this Post